Viewing your trends
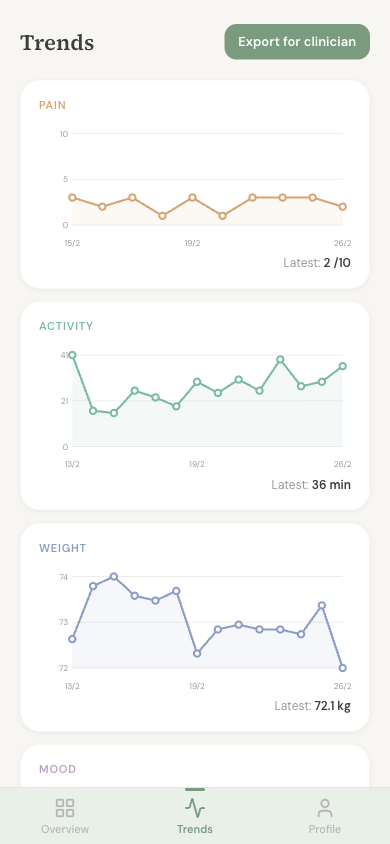
Tap the Trends tab at the bottom of the screen to see charts of your recovery over time. You'll see small charts for things like:
- Pain levels
- Walking and activity
- Weight
- Mood
These charts fill in automatically as you log each day. The more days you log, the more useful the trends become.
You can press and hold on any point in a chart to see the details for that particular day.
Creating a report for your medical team
You can create a clear, easy-to-read report of your recovery data to share with your transplant team. This can be really helpful at clinic appointments.
How to create a report
- 1 Go to the Trends tab
- 2 Tap the Export for clinician button
- 3 Choose the time period you'd like to cover — 1 week, 1 month, or 3 months
- 4 The report will open — you can then print it or save it
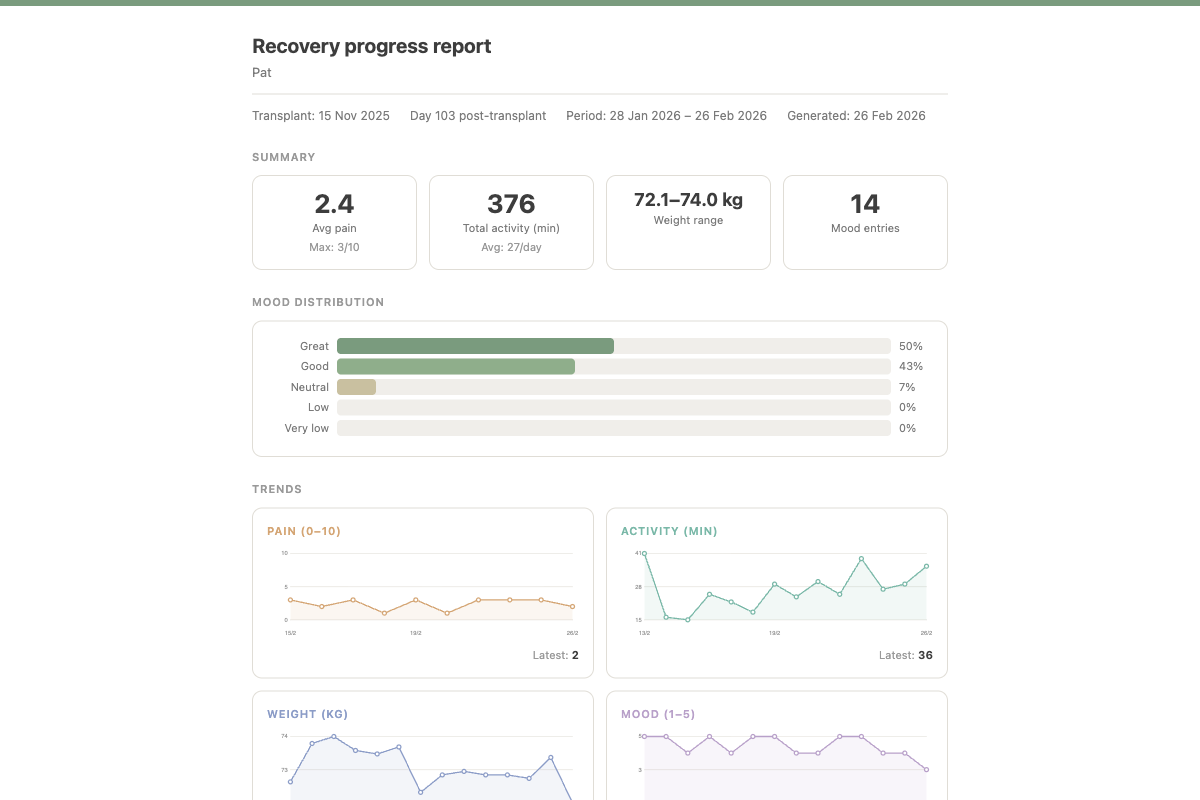
What's in the report
The report is designed to be easy for your medical team to read at a glance. It includes:
- Summary statistics — averages and ranges for your key measurements
- Mood overview — how your mood has been distributed
- Trend charts — visual charts showing changes over time
- Daily log table — a day-by-day breakdown of everything you recorded
The report opens in your web browser so you can print it, save it as a PDF, or email it. No special software is needed.
Tips for clinic appointments
Try generating a report a day or two before your appointment so you can look it over and note down any questions. You can also create a report from the Clinic Appointments section that covers just the time since your last visit — see Clinic Appointments for more.